
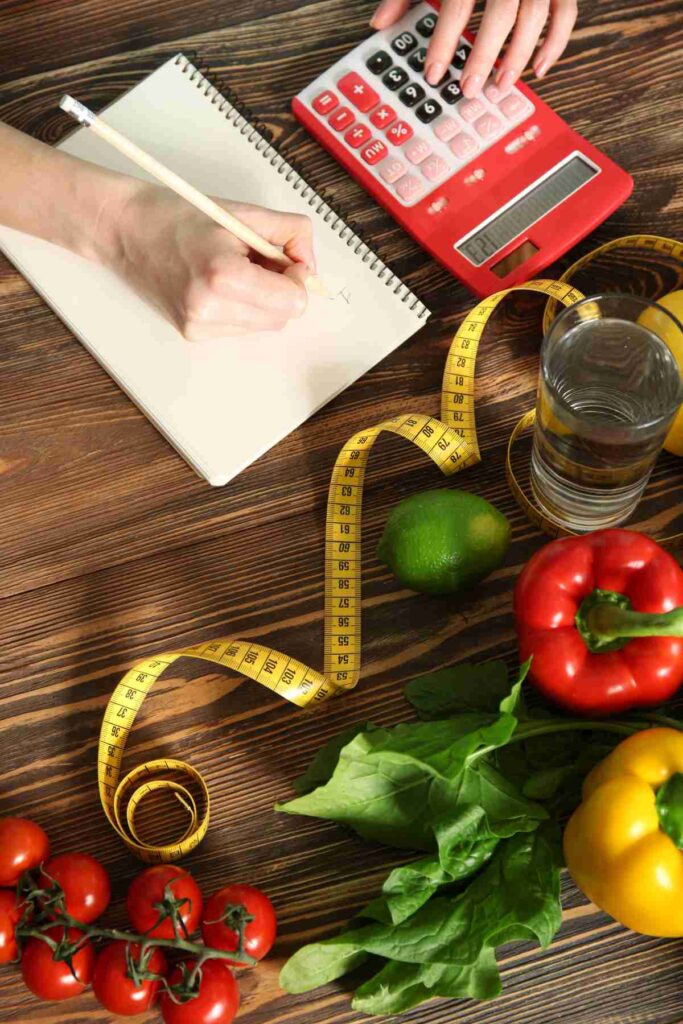
Below is a calorie density chart showing the calorie density of 60 common foods. This chart gives the number of calories per 100g (or 3.5 oz) of food.
| Food Type | Calories per 100g (3.5 oz) |
| Lettuce – iceberg | 14 |
| Celery | 14 |
| Cucumber | 15 |
| Tomatoes | 19 |
| Red peppers | 21 |
| Mushrooms – white | 22 |
| Cauliflower | 25 |
| Kale | 28 |
| Strawberries | 32 |
| Melon – Cantaloupe | 34 |
| Broccoli | 34 |
| Onion | 40 |
| Carrots | 41 |
| Butternut squash | 45 |
| Orange | 47 |
| Apple | 52 |
| Blueberries | 57 |
| Yoghurt, Greek, non-fat | 59 |
| Grapes | 67 |
| Potatoes | 70 |
| Oats – cooked in water | 71 |
| Tofu | 76 |
| Sweet potatoes | 86 |
| Sweetcorn | 86 |
| Bananas | 90 |
| Tomato ketchup – Heinz | 102 |
| Beef (lean) 5% fat | 124 |
| kidney beans (cooked) | 127 |
| Tuna (canned) | 128 |
| white rice (cooked) | 130 |
| Green lentils (cooked) | 143 |
| Egg whole – hardboiled | 155 |
| Pasta (cooked) | 155 |
| Chicken (breast) grilled | 165 |
| chickpeas (cooked) | 180 |
| Salmon | 208 |
| BK Whopper UK | 212 |
| Pizza – Goodfella’s thin base pepperoni | 251 |
| Bread – white | 266 |
| Beef (rib eye, fat trimmed, grilled ) | 271 |
| Mozzerela cheese | 280 |
| Lamb – USDA | 294 |
| Raisins | 299 |
| French fries (McDonalds) | 323 |
| Wholemeal flour | 340 |
| White flour | 364 |
| Oats – uncooked | 379 |
| Table sugar | 387 |
| Cheddar cheese | 402 |
| Chocolate chip cookies | 488 |
| Flaxseed (linseed) | 534 |
| Crisps (potato chips) | 540 |
| Bacon | 541 |
| Cashew nuts | 553 |
| Almonds | 576 |
| Sunflower seeeds | 581 |
| Peanut butter | 588 |
| Mayonnaise – Heinz | 644 |
| Butter | 717 |
| Oil | 880 |
Please note that the calories provided in this chart are based on several sources such as the USDA and popular providers of the nutrition breakdown of foods such as Nutritionix. In some cases there was a divergence in calories between different sources and I tried to choose the data that was less of an outlier in each case. In any case, the calories provided on nutritional labels are not an exact measure of the calories the person receives from the particular food and should be used more as an approximate guideline.
How to calculate caloric density?
Caloric density is measured by expressing the number of calories for a given weight of food. It is useful as a comparison tool between different foods. The key is to keep the weight standard so different foods can be compared for how many calories they contain for the same wieght of a particular food.
Calorie Density Points
- Fruits and vegetables tend to be the lowest calorie density foods
- The calorie density of meats is related to how much fat they contain – fatty meats are more calorie dense than lean meats
- Cooking in water reduces the calorie density of many dry starchy foods – foods such as rice, pasta and porridge oats absorb water when they are cooked so the cooked versions are less calorie dense than the uncooked versions
- The calorie density of foods can be related to what they are prepared with – for instance, potatoes are quite low on the calory density spectrum, but fried in oil as french fries (chips), or cooked in oil as potato chips (crisps), they are on the higher end of the calorie density spectrum.
To learn more about calorie density and how it may be applied in a weight loss/management strategy you can also check out the following article